
7. Evapotranspiration#
Evapotranspiration is a key process of water balance and also an important element of energy balance (Zhao et al., 2013). It covers both water evaporation (movement of water to the air directly from soil, canopies, and water bodies) and transpiration (movement of water from the soil, through roots and bodies of vegetation, on leaves and then into the air). Its precise estimation is not only of vital importance for the study of climate change and evaluation of water resources, but also has much application value in crop water requirement management, drought forecasting and monitoring, effective water resources development and utilization etc.
There are many methods to estimate evapotranspiration, from those taking into account evaporation from water surface to a variety of potential evapotranspiration and actual evapotranspiration estimations. In the FeST model two methods are implemented to compute actual evapotranspiration: one first estimates potential evapotranspiration (\({ET}_{p}\)) and then converts it into actual evapotranspiration (\({ET}_{a}\)) applying a stress coefficient; the other one computes directly \({ET}_{a}\) by solving the system of mass and energy balance equations.
Methods to estimate \({ET}_{p}\) can be classified into one of the following four categories:
temperature-based (e.g., Hargreaves and Samani, 1985);
radiation based (e.g., Makkink, 1957);
mass-based (e.g., Mahring, 1970);
methods combining energy and mass balance (e.g., Penman, 1948).
BOX 7.A Potential and actual evapotranspiration
The term potential evapotranspiration (\({ET}_{p}\)), due to Thornthwaite (1948), stands for the maximum rate of water loss by evaporation from the land surface under given atmospheric conditions, given abundant supply of soil moisture, that means assuming no control on water supply. Actual evapotranspiration (\({ET}_{a}\)) is the quantity of water that is actually removed from a surface due to the processes of evaporation and transpiration and is limited by the amount of water that is available.
7.1. Potential evapotranspiration#
Five methods are implemented in the FeST model to estimate \({ET}_{p}\) :
Hargreaves-Samani
Hargreaves-Samani-Ravazzani
Priestley-Taylor
Penman-Monteith
FAO Penman-Monteith
BOX 7.B Reference evapotranspiration and the crop coefficient
The term reference evapotranspiration, denoted as \({ET}_{0}\), stands for the evapotranspiration from the reference surface, the so-called reference crop evapotranspiration, as defined by the Food and Agriculture Organization of the United Nations (FAO). The reference surface is a hypothetical grass reference crop with an assumed crop height of 0.12 m, a fixed surface resistance of 70 s m⁻¹ and an albedo of 0.23. The only factors affecting \({ET}_{0}\) are climatic parameters. Consequently, \({ET}_{0}\) is a climatic parameter and can be computed from weather data. \({ET}_{0}\) expresses the evaporating power of the atmosphere at a specific location and time of the year and does not consider the crop characteristics and soil factors. Typical ranges for \({ET}_{0}\) values for different agroclimatic regions are given in the following Table.
Average \({ET}_{0}\) for different agroclimatic regions in mm/day
Cool ~10°C |
Moderate 20°C |
Warm > 30°C |
|
|---|---|---|---|
Tropics and subtropics |
|||
- humid and sub-humid |
2 - 3 |
3 - 5 |
5 - 7 |
-arid and semi-arid |
2 - 4 |
4 - 6 |
6 - 8 |
Temperate region |
|||
- humid and sub-humid |
1 - 2 |
2 - 4 |
4 - 7 |
-arid and semi-arid |
1 - 3 |
4 - 7 |
6 - 9 |
Reference evapotranspiration intends to avoid ambiguities that existed in the definition of potential evapotranspiration. By adopting a reference crop (grass), consistent crop coefficient selection has become easier and more practical (Djaman, 2013). The introduction of the reference evapotranspiration concept also helped transfer crop coefficients from one location to another. Reference evapotranspiration allows more consistent crop coefficient selection and evapotranspiration equation calibration for a given local climate.
Historically, two main crops have been used as the reference crop, grass, and alfalfa. It is generally accepted that the grass reference crop is the type of grass with physiological and structural characteristics similar to perennial ryegrass (Lolium perenne L.) or alta fescue (Festuca arundinacea Schreb. Alta). Although alfalfa has the physical characteristics (leaf area index, roughness, etc.) closer to many agronomic crops than the grass, researchers generally agree that a clipped grass provides a better representation of reference evapotranspiration than does alfalfa. This is mainly because of the two reasons: (FAO, 1998) the characteristics of the grass are better known and defined, (McMahon, 2013) the grass crop has more planting areas than alfalfa throughout the world, and the measured evapotranspiration rates of the grass are more readily available and accessible as compared to the measured alfalfa evapotranspiration rates.
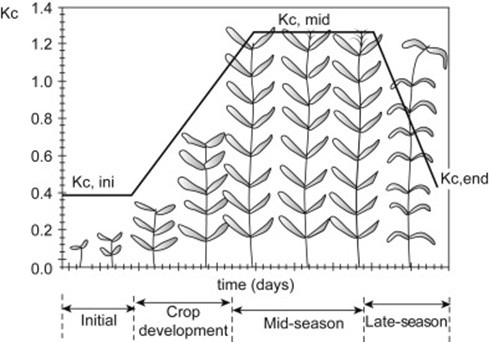
To compute the evapotranspiration of the specific crop, \({ET}_{C}\ \), a crop coefficient, \(K_{c}\), is used.
Changes in vegetation and ground cover mean that the crop coefficient \(K_{c}\) varies during the growing period. The trends in \(K_{c}\) during the growing period are represented in the crop coefficient curve.
7.1.1. Hargreaves-Samani#
The Hargreaves and Samani (1985) equation for calculating daily potential evapotranspiration is:
where \({ET}_{P - HS}\) is the potential evapotranspiration estimated by the Hargreaves-Samani equation (mm day⁻¹), \(R_{a}\) extraterrestrial radiation (mm day⁻¹), \(T_{\max}\) daily maximum air temperature (°C), \(T_{\min}\) daily minimum air temperature (°C), \(HC\) empirial coefficient (\(HC = 0.0023\)), \(HE\) empirical exponent (\(HE = 0.5\)), and \(HT\) is needed to convert units of Fahrenheit to Celsius (\(HT = 32/1.8 = 17.8\)) (Hargreaves, 1994). Equation (7.2) uses the average daily air temperature in combination with extraterrestrial radiation as an indicator of the incoming global radiation. Moreover, the daily temperature range is related to relative humidity and cloudiness (Hargreaves and Samani, 1982; Samani and Pessarakli, 1986; Shuttleworth, 1993; Di Stefano and Ferro, 1997).
7.1.2. Hargreaves-Samani-Ravazzani#
Ravazzani et al. (2012) introduced a correction factor based on two calibrating coefficients, \(c_{0}\) and \(c_{1}\), to fix the general tendency of Hargreaves-Samani to overestimate evapotranspiration at low elevation and underestimate it at higher elevations in the italian Alps:
where \(ET_{P - HSR}\) is the reference evapotranspiration computed with the modified equation and \(z\) is station elevation (m a.s.l.). Coefficients in equation 7-3 were determined by choosing \(c_{0}\) and \(c_{1}\) to minimize the mean bias error on stations belonging to upper Po river basin, Italy. The algorithm adopted for optimization was the generalized reduced gradient, a nonlinear extension of the simplex method for linear programming (Lasdon et al., 1978). The values of the best fit calibrating parameters are 0.817 for \(c_{0}\) and 0.00022 for \(c_{1}\). The final modified equation to compute potential evapotranspiration can then be rewritten:
7.1.3. Penman and Penman-Monteith#
The Penman equation describes potential evaporation from an open water surface, and was developed by Howard Penman in 1948. Penman’s equation requires air temperature, wind speed, air relative humidity, and solar radiation to predict potential evaporation.
where
\(E_{P - P}\) potential evapotranspiration estimated by the Penman equation (mm s⁻¹)
\(\mathrm{\Delta}\) slope of the relationship between saturation vapour pressure and temperature (kPa°C⁻¹) computed as:
\(T\) air temperature (°C)
\(R_{n}\) net radiation (MJ m⁻² s⁻¹)
\(G\) ground heat flux (MJ m⁻² s⁻¹) computed as
\(\rho_{a}\) air density (kg m⁻³) computed as
\(R\) specific gas constant = 0.287 (kJ kg⁻¹ K⁻¹)
\(T_{kv}\) virtual air temperature (K) computed as
\(P\) air pressure (kPa) computed as
\(z\) ground elevation (m asl)
\(c_{p}\) humid air specific heat (MJ kg⁻¹ °C⁻¹) computed as
\(\gamma\) psychrometric constant (kPa °C⁻¹) computed as
\(\varepsilon = 0.622\) ratio molecular weight of water vapour/dry air
\(\ \lambda = 2.453\) latent heat of vaporization (MJ / kg)
\(e^{*}\) saturation vapor pressure (Pa) computed as
\(e_{a}\) actual vapor pressure (Pa) computed as
\(RH\) air relative humidity (0-100).
\(r_{a}\) aerodynamic resistance of bare soil (s m⁻¹) computed as
\(z_{m}\) wind speed measurement heigth (m)
\(h = 0.1\) bare soil heigth (m)
\(d = \ \frac{2}{3}\ h\) bare soil zero plane displacement height (m)
\(z_{om}\ 0.123\ h\) roughness length governing momentum transfer (m)
\(z_{h}\) relative humidity measurement height (m)
\(z_{oh} = 0.1\ z_{om}\) roughness length governing transfer of heat and vapor (m)
\(k = 0.41\) von Karman’s constant
\(u_{z}\) wind speed (m/s)
When vegetation is present, plant transpiration that is the vaporization of liquid water and subsequent loss of water as vapor through leaf stomata, must be included as a component of the evapotranspiration. For this purpose, the Penman equation was further developed by Monteith (1965) and extended to cropped surfaces by introducing resistance factors, giving origin to the Penman-Monteith equation.
where
\(T_{P - PM}\) potential transpiration estimated by the Penman-Monteith equation (mm s-1)
\(r_{c}\) canopy resistance (s m-1) conputed as
\(r_{s\ \min}\) minimum stomatal resistance (s m-1)
\(LAI\) leaf area index (m²/m²)
Aerodynamic resistance of vegetated soil in Penman-Monteith equation is computed considering the crop height.
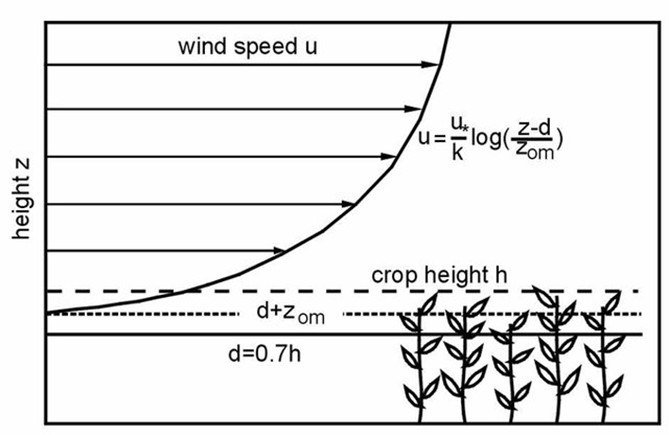
Fig. 7.1 Vertical distribution of wind speed over a vegetated surface of height \(h\). The profile follows the logarithmic distribution. The zero plane displacement \(d\) is about \(0.7\ h\). The wind speed becomes zero at \(\ d + \ z_{om}\) (Immerzeel et al., 2006)#
7.1.4. FAO Penman-Monteith#
The FAO-56 Penman-Monteith equation for calculating reference evapotranspiration (Allen et al., 1998) is:
where: \(ET_{0 - PM}\) is the reference evapotranspiration estimated by the FAO-56 Penman-Monteith equation (mm day⁻¹), \(R_{n}\) net radiation (MJ m⁻² day⁻¹), \(G\) soil heat flux (MJ m⁻² day⁻¹), \(T\) average daily air temperature at 2 m height (°C), \(U_{2}\) wind speed at 2 m height (m s⁻¹), \(e_{s}\) saturation vapour pressure (kPa), \(e_{a}\) actual vapour pressure (kPa), \(\Delta\) slope of the saturated water-vapor-pressure curve (kPa °C⁻¹), \(\gamma\) the psychrometric constant (kPa °C⁻¹). The computation of all data required for the calculation of the reference evapotranspiration followed the method given in Chapter 3 of the FAO paper 56 (Allen et al., 1998).
7.1.5. Priestley-Taylor#
The Priestley-Taylor equation (Priestley and Taylor, 1972) is similar to the Penman-Monteith method, but simplified. That is, vapor deficit and convection terms are reduced to a single empirical constant, \(\alpha\). The Priestley-Taylor model can be represented as follows:
where
\(E_{P - PT}\) potential evaporation estimated by the Priestley-Taylor equation (mm s⁻¹).
\(\alpha\ =\ 1.26\) an empirical constant accounting for the vapor pressure deficit and resistance values (-).
Transpiration from vegetated surface has the same expression but the soil heat flux is negligible:
where
\(T_{P - PT}\) potential transpiration estimated by the Priestley-Taylor equation (mm s⁻¹).
The terms in Equation (7.19), and Equation (7.20) are computed in the same way explained for Penman-Monteith equation.
Priestley-Taylor equation requires air temperature, air relative humidity, and solar radiation to predict potential evapotranspiration.
7.2. Actual evapotranspiration from potential one#
The actual evapotranspiration, \({ET}_{a}\), is computed as a fraction of the potential rate tuned by a function that, in turn, depends on soil moisture content, and weighted according to the vegetation fraction coverage.
The global actual evapotranspiration rate is given by:
where \(E_{a}\) is the actual rate of bare soil evaporation, \(T_{a}\) is the actual rate of transpiration, and \(f_{v}\) is the fraction of vegetation area. The actual rates of the bare soil evaporation and transpiration are computed as a fraction of the potential evaporation, \(E_{P}\), and potential transpiration, \(T_{P}\) (Parlange et al., 1999):
Where \(\alpha(\theta)\) and \(\beta(\theta)\) are stress coefficient computed as:
and where \(\theta\) (-), \(\theta_{fc}\) (-), and \(\theta_{wp}\) (-) are current water content, field capacity, and wilting point, respectively.